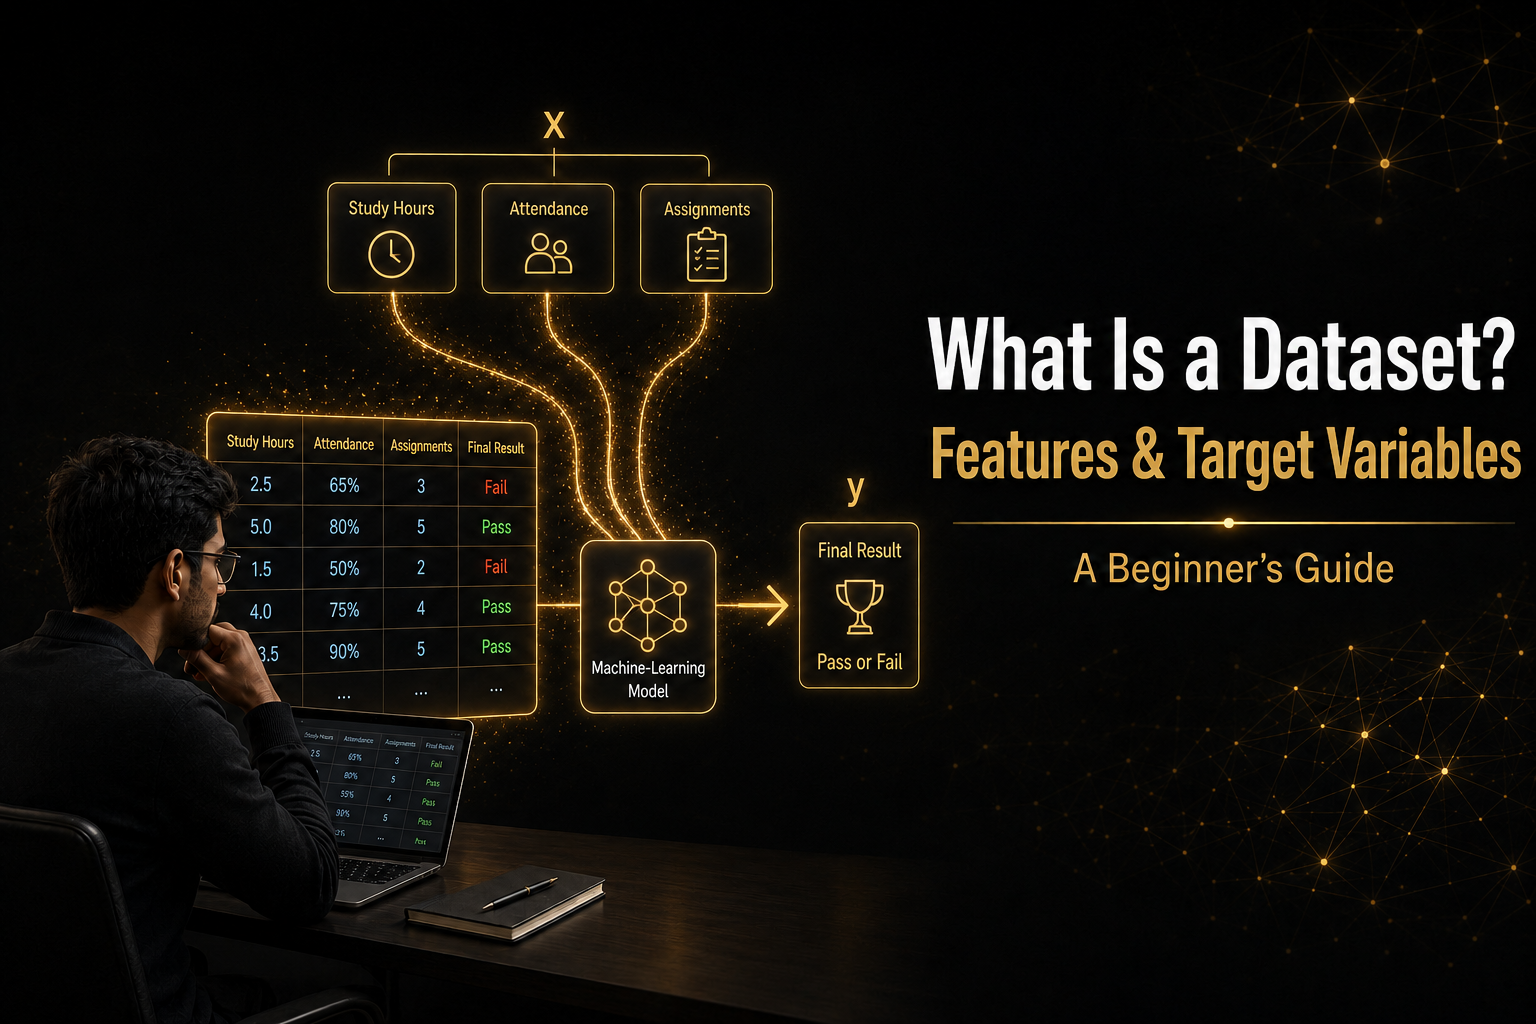
When beginners start learning machine learning, they often hear words such as dataset, features, variables, inputs and targets. These terms may sound technical, but they describe a simple idea: using information we already know to understand or predict an outcome.
Before selecting an algorithm or writing any code, you must first understand how a dataset is organized. You should be able to identify what each row represents, what information is stored in each column, which columns can be used as inputs and which column contains the result you want to predict.
In this beginner-friendly guide, we will first use a familiar student-result example to understand these concepts in simple language. We will then apply the same idea to a technical customer-churn dataset and learn how independent features help a machine-learning model predict a target variable.
Imagine that a teacher wants to understand what may affect a student’s final examination result.
The teacher collects the following information:
| Student | Study Hours | Attendance | Assignments Completed | Final Result |
|---|---|---|---|---|
| Student A | 8 | 95% | 10 | Pass |
| Student B | 2 | 60% | 4 | Fail |
| Student C | 6 | 88% | 9 | Pass |
| Student D | 1 | 50% | 3 | Fail |
This organized table of student information is called a dataset.
A dataset is an organized collection of related information. It usually contains rows, columns and values.
A dataset can be stored in different formats, such as:
- CSV file
- Excel spreadsheet
- SQL database
- JSON file
- Text file
- Online business application
A row represents one individual record or observation.
In the student dataset, each row represents one student.
- Studied for two hours
- Had 60% attendance
- Completed four assignments
- Failed the final examination
| Dataset | Each Row Represents |
|---|---|
| Student dataset | One student |
| Sales dataset | One order |
| Employee dataset | One employee |
| Healthcare dataset | One patient |
| Housing dataset | One property |
A column represents one type of information collected about every record.
| Column | Meaning |
|---|---|
| Student | Identifies the student |
| Study Hours | Number of hours studied |
| Attendance | Percentage of classes attended |
| Assignments Completed | Number of assignments completed |
| Final Result | Whether the student passed or failed |
A column may also be called a:
- Variable
- Attribute
- Field
- Feature
A value is the information stored where a row and column meet.
Study Hours = 2
Attendance = 60%
Assignments Completed = 4
Final Result = Fail
Columns describe the type of information, while values contain the actual information for each record.
Imagine that the teacher wants to predict whether a new student will pass or fail.
The teacher may use:
- Study hours
- Attendance
- Assignments completed
These are called independent variables because they provide information that may help explain or predict the final result.
Independent variables are also called:
- Input variables
- Predictor variables
- Features
- X variables
The dependent variable is the result we want to understand or predict.
In the student example, the dependent variable is:
Final Result = Pass or FailIt is called dependent because the final result may depend on information such as study hours, attendance and completed assignments.
The dependent variable is also called:
- Target variable
- Output variable
- Response variable
- Label
- y variable
| Independent Variables | Dependent Variable |
|---|---|
| Information used to make a prediction | Result we want to predict |
| Model inputs | Model output |
| Features | Target |
| Represented by X | Represented by y |
| Study hours, attendance and assignments | Final result |
Suppose a new student has:
- Seven study hours
- 92% attendance
- Nine completed assignments
The historical dataset shows that students with similar information generally passed.
Predicted Final Result = PassNow let us apply the same concept to a business machine-learning project.
Imagine that a subscription company wants to predict which customers may cancel their subscriptions. Cancelling a subscription is called customer churn.
| Customer ID | Tenure | Monthly Charges | Contract Type | Support Calls | Churn |
|---|---|---|---|---|---|
| C101 | 24 | $59 | One Year | 1 | No |
| C102 | 3 | $95 | Month-to-Month | 5 | Yes |
| C103 | 18 | $70 | One Year | 2 | No |
| C104 | 2 | $105 | Month-to-Month | 6 | Yes |
- Each row represents one customer.
- Each column contains one type of customer information.
- Churn shows whether the customer cancelled.
The company may use the following features to predict churn:
| Independent Feature | What It Tells Us |
|---|---|
| Tenure | How long the customer has stayed |
| Monthly Charges | How much the customer pays |
| Contract Type | The customer’s subscription agreement |
| Support Calls | How often the customer requested help |
X = Tenure + Monthly Charges + Contract Type + Support CallsThe company wants to predict whether a customer will cancel.
Therefore, the dependent or target variable is:
y = Churn| Churn Value | Meaning |
|---|---|
| No | The customer stayed |
| Yes | The customer cancelled |
During training, the model receives historical customer features and the known churn result.
3 months + $95 + Month-to-Month + 5 calls → Churned

24 months + $59 + One-Year + 1 call → Stayed
The model examines many records and learns patterns. It can then receive information about a new customer:
2 months + $100 + Month-to-Month + 6 callsThe model may predict:
High likelihood of churnThe company can use this prediction to decide whether to contact the customer or offer additional support.
Numerical features contain measurable or countable numbers.
- Study hours
- Age
- Salary
- Product price
- Monthly charges
- Number of support calls
Categorical features contain groups or labels.
- Contract type
- Payment method
- Product category
- Membership level
- City
- Order date
- Registration date
- Delivery time
- Appointment date
- Customer reviews
- Support messages
- Product descriptions
- Email content
No. Every column should not automatically be given to the model.
A customer ID identifies a customer, but it may not explain why that customer churned. A customer’s name may also be unnecessary and could create privacy concerns.
Before selecting a feature, ask:
- Does this column help answer the problem?
- Will this information be available when making a future prediction?
- Is the column only an identifier?
- Does it contain private or sensitive information?
- Could it create unfair predictions?
- Does it reveal the answer directly?
Classification predicts a category.
| Project | Target |
|---|---|
| Customer-churn prediction | Yes or No |
| Student-result prediction | Pass or Fail |
| Loan decision | Approved or Rejected |
| Email detection | Spam or Not Spam |
Regression predicts a numerical value.
| Project | Target |
|---|---|
| House-price prediction | Property price |
| Sales forecasting | Sales amount |
| Delivery-time prediction | Number of minutes |
| Salary estimation | Salary amount |
Not every machine-learning dataset contains a target.
For example, a company may want to group customers based on similar purchasing habits. The dataset may contain:
- Number of purchases
- Average order value
- Shopping frequency
- Product preferences
The company does not already know the groups. The model discovers them by finding similarities in the data. This is called clustering.
Unsupervised learning: The dataset does not contain a target.
- What does each row represent?
- What does each column represent?
- What problem are we trying to solve?
- What is the target variable?
- Which columns may help predict the target?
- Which columns are only identifiers?
- Are important values missing?
- Will these features be available when making a prediction?
- Does any column reveal the answer?
- Do we have permission to use this data?
- A dataset is an organized collection of information.
- A row represents one record or observation.
- A column represents one type of information.
- A feature is information used to make a prediction.
- An independent variable (X) is a model input.
- A dependent variable (y) is the result we want to predict.
- The dependent variable is also called the target variable.
- Not every dataset column should be used as a feature.
Once you understand this relationship, learning how a machine-learning model is trained and evaluated becomes much easier.