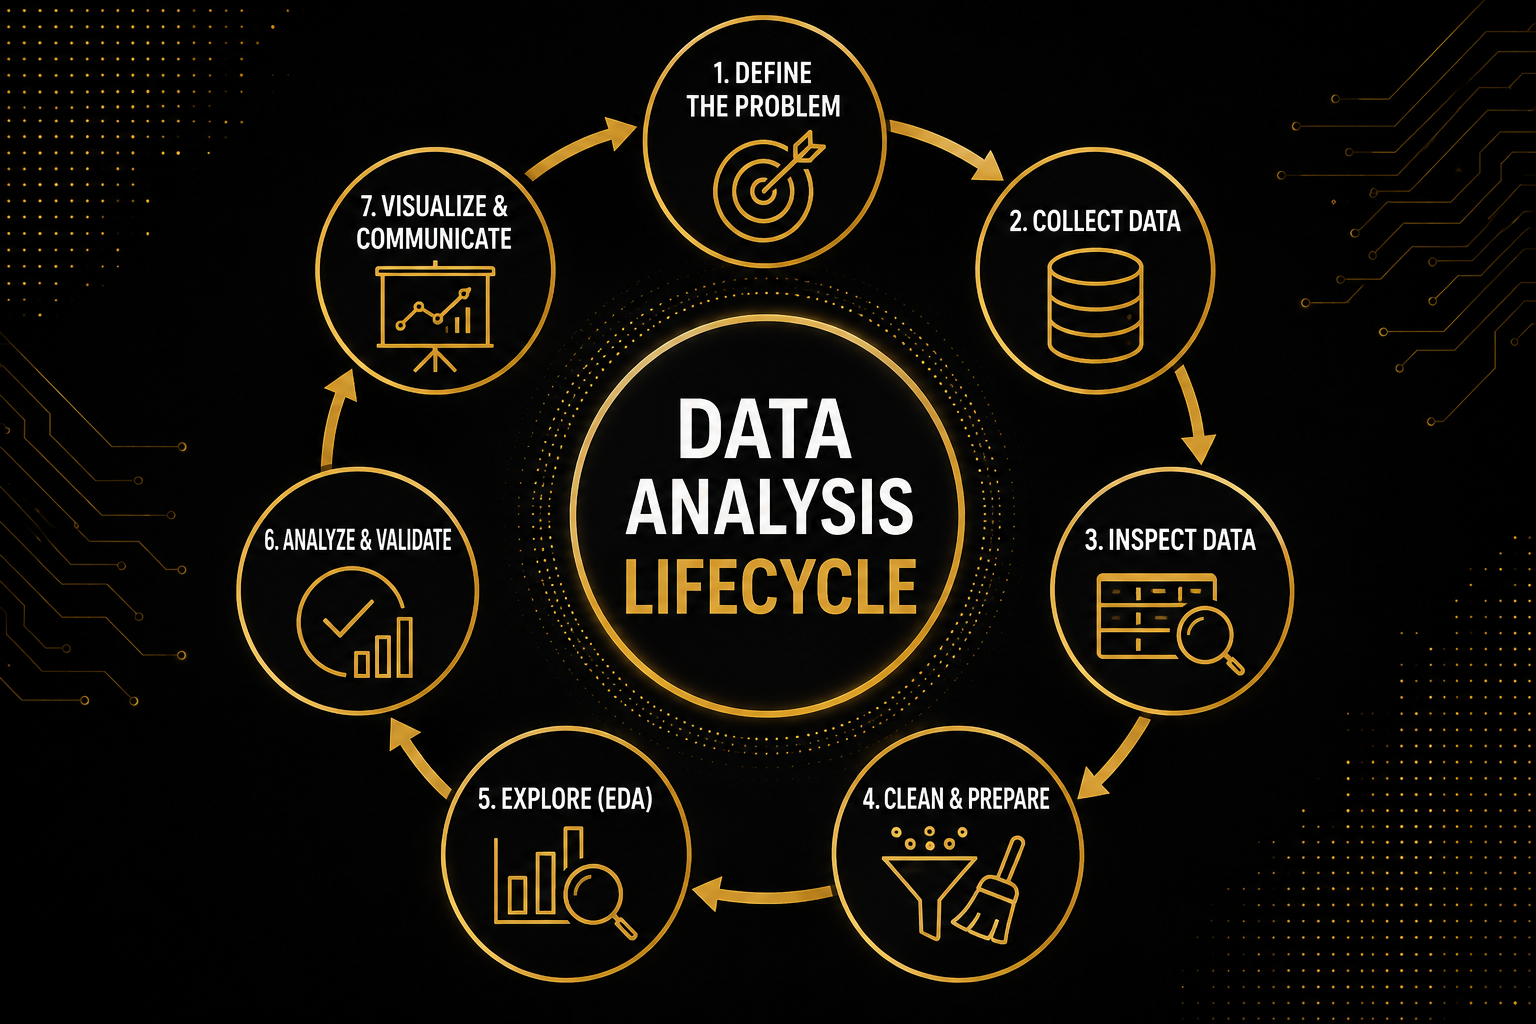
When beginners receive a new dataset, they often do not know where to begin. Should they clean the data, create charts or immediately start writing SQL and Python code?
A data analyst follows a structured process. This process converts raw data into useful information that supports business decisions.
Define the Problem
Always begin with the business problem—not with the dataset, chart or code.
Before starting the analysis, understand:
- Why is the analysis needed?
- What does the business want to discover?
- Which decision will the analysis support?
- Who will use the results?
Instead of asking, “What is available in the sales data?”, ask a focused question:
“Why did sales decrease during the last quarter?”
A clear business problem gives your analysis direction and helps you avoid creating unnecessary calculations or charts.
Collect the Data
Identify the information required to answer the business question.
Data may come from:
- SQL databases
- CSV or Excel files
- Business applications
- Surveys
- Websites
- APIs
For a sales analysis, you may need customer, order, product and return data.
Inspect the Data
Do not immediately change the dataset. First inspect its structure and identify possible problems.
Check the following:
- How many rows and columns are present?
- What does each row represent?
- What are the column names?
- Are the data types correct?
- Are any values missing?
- Are duplicate records present?
- What period does the data cover?
In Python and Pandas, beginners can start with:
df.head()
df.shape
df.info()
df.describe()
head()
Displays the first few records.
shape
Shows the number of rows and columns.
info()
Shows column names, data types and missing values.
describe()
Provides summary statistics for numerical columns.
Clean and Prepare the Data
Raw data frequently contains problems that must be handled before beginning the analysis.
Data cleaning may include:
- Investigating duplicate records
- Handling missing values
- Correcting data types
- Standardizing category names
- Fixing date formats
- Removing unnecessary spaces
- Checking invalid values
- Renaming unclear columns
- Creating calculated columns
The goal is to create an accurate, consistent and analysis-ready dataset.
Explore the Data — EDA
EDA stands for Exploratory Data Analysis.
EDA means getting to know your dataset before making final conclusions.
During EDA, you explore:
- Minimum, maximum and average values
- Most common categories
- How numerical values are distributed
- Sales or activity over time
- Differences between customer groups
- Unusual or extreme values
- Possible relationships between columns
For example, you may compare:
EDA helps you discover patterns, identify unusual results and decide which areas require deeper investigation.
Analyze and Validate
After exploring the dataset, return to the original business questions.
“Why did sales decrease during the last quarter?”
To answer this question, you might analyze:
- Monthly revenue
- Number of orders
- Average order value
- Sales by region
- Sales by product category
- Product returns and cancellations
Validate Your Results
Validation means checking whether your calculations and findings are accurate and trustworthy.
- Were the correct dates used?
- Did table joins create duplicate rows?
- Were cancelled orders included?
- Are missing values affecting the calculation?
- Do the totals make business sense?
- Can the result be confirmed using another calculation?
Visualize and Communicate
The final step is to present the findings in a way that other people can easily understand.
Line Chart
Use it to show trends over time.
Bar Chart
Use it to compare categories.
Histogram
Use it to understand the distribution of values.
Scatter Plot
Use it to examine a relationship between two variables.
KPI Cards
Use them to present important totals and measures.
Do not present only numbers and charts. Explain what the results mean for the business.
Sales in the West region decreased by 18%.
The decrease was mainly caused by lower electronics sales and an increase in product returns.
Investigate customer complaints, product quality and return reasons for electronics sold in the West region.
A Simple Process to Remember
Final Thoughts
Data analysis is not simply about writing code or creating attractive dashboards. It is about using a clear process to convert raw data into trustworthy business insights.
Beginners should remember this simple rule:
At SAI DataScience, students follow this complete process using realistic datasets and business problems. This helps them develop technical skills, analytical thinking and job-ready portfolio projects.