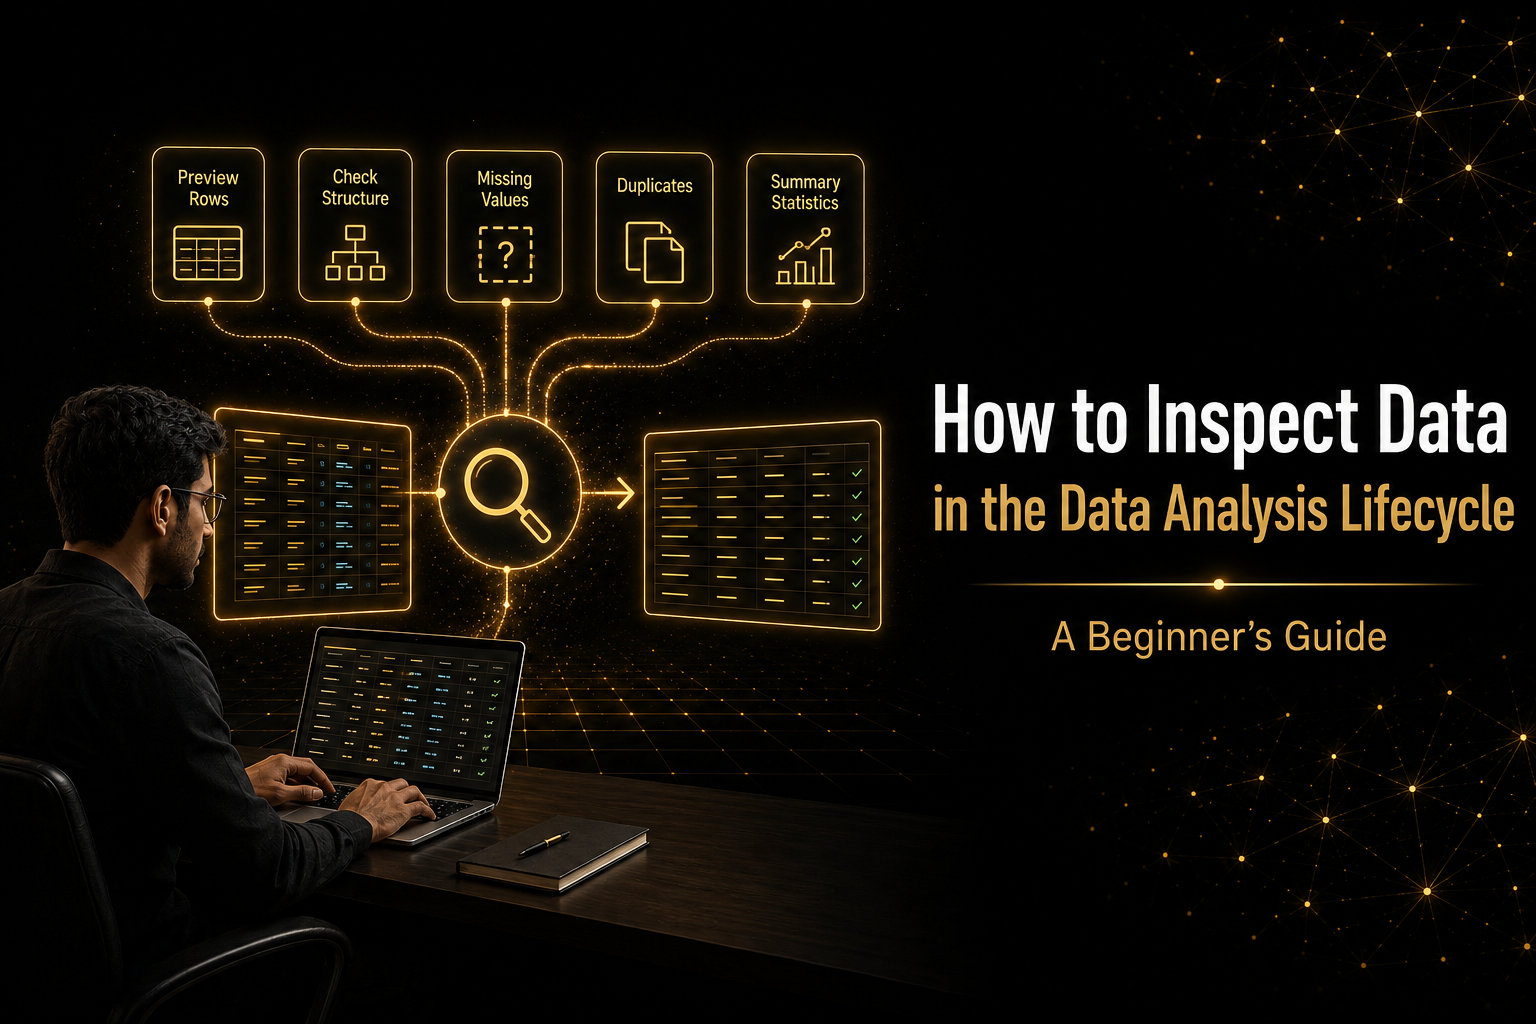
Before analyzing a dataset, creating charts or building a dashboard, a data analyst must first understand what the data contains. This step is called data inspection. Data inspection helps you answer important questions:
- How large is the dataset?
- What does each row represent?
- What columns are available?
- Which columns contain numbers, categories or dates?
- Are any values missing?
- Are there duplicate records?
- Do any values appear unusual or incorrect?
- Can this dataset answer the business question?
Skipping this step can lead to incorrect calculations, misleading charts and unreliable business recommendations.
Where Does Data Inspection Fit?
A simple data-analysis lifecycle may include:
- Define the business problem
- Collect or receive the data
- Inspect the data
- Clean and prepare the data
- Analyze the data
- Visualize the findings
- Communicate recommendations
- Validate and monitor the results
A Real-World Example
Imagine receiving a box of customer application forms.
Before using the information, you would probably check:
- How many forms are in the box?
- Are all the forms using the same format?
- Are important answers missing?
- Has anyone submitted the same form twice?
- Are dates written consistently?
- Do any ages, prices or other values look impossible?
Inspecting a dataset follows the same idea. You examine its structure and condition before trusting it.
Start with the Business Question
Before opening the dataset, clarify what the analysis is expected to accomplish.
This question suggests that the dataset may need:
- A customer identifier
- Subscription type
- Customer tenure
- Monthly charges
- Support activity
- Churn status
Load the Dataset
A CSV file can be loaded with Pandas:
import pandas as pd

customers = pd.read_csv("customer_data.csv")
The variable customers now contains a Pandas DataFrame.
A DataFrame is a table-like structure containing rows and columns.
Preview the Records
Display the first five rows:
customers.head()Display the first ten rows:
customers.head(10)You can also inspect the last five rows:
customers.tail()This preview helps you examine:
- Column names
- Example values
- General formatting
- Possible missing values
- Unexpected categories
- Whether the file loaded correctly
head() is only the beginning of inspection.
Understand What One Row Represents
One row might represent:
- One customer
- One order
- One product
- One support ticket
- One shipment
- One monthly account record
Suppose one row represents an order. The same customer may correctly appear several times because one customer can place multiple orders. Repeated customer IDs would not automatically be duplicate records.
Check the Dataset Size
customers.shapeAn output such as (5000, 12) means:
- 5,000 rows
- 12 columns
You can store the values separately:
rows, columns = customers.shape

print("Number of rows:", rows)
print("Number of columns:", columns)Review the Column Names
customers.columnsOr display them as a list:
customers.columns.tolist()Look for:
- Extra spaces
- Unclear abbreviations
- Inconsistent capitalization
- Duplicate column names
- Misspelled names
- Names that do not match the data dictionary
Customer ID, monthly_charge,
SubscriptionType and Churn Status use
inconsistent naming styles.
These names may later be standardized, but inspection should document the issue before changing anything.
Inspect Data Types and Non-Null Counts
customers.info()info() displays:
- Column names
- Number of non-null values
- Data types
- Dataset memory usage
| Data Type | Typical Meaning |
|---|---|
int64 | Whole numbers |
float64 | Decimal numbers |
object | Usually text or mixed values |
bool | True or False |
datetime64 | Date and time values |
category | Repeated categorical values |
Look for problems such as:
- Monthly charges stored as text
- Dates stored as ordinary strings
- Identifiers incorrectly treated as measures
- Numbers containing currency symbols
- Columns containing both numbers and text
Review Summary Statistics
customers.describe()For numeric columns, this commonly displays:
- Count
- Mean
- Standard deviation
- Minimum
- 25th percentile
- Median
- 75th percentile
- Maximum
Ask:
- Does the minimum age appear reasonable?
- Are any monthly charges negative?
- Is the maximum value unusually high?
- Are the mean and median very different?
- Do the numeric ranges make business sense?
To include categorical columns:
customers.describe(include="all")Check Missing Values
Count missing values:
customers.isna().sum()Calculate missing percentages:
missing_percentage = (
    customers.isna().mean() * 100
).round(2)

missing_percentage
Create a reusable report:
missing_report = pd.DataFrame({
    "Missing_Count": customers.isna().sum(),
    "Missing_Percentage": (
        customers.isna().mean() * 100
    ).round(2)
})

missing_report.sort_values(
    "Missing_Percentage",
    ascending=False
)
Interpret missing values in context:
- Missing age might be manageable.
- Missing customer ID could affect record identification.
- Missing churn status could directly affect churn analysis.
- Missing payment date could affect time-based reporting.
N/A, Unknown, - and blank spaces.
Inspect Duplicate Records
customers.duplicated().sum()Display every copy of duplicated rows:
customers[
    customers.duplicated(keep=False)
]
Inspect an identifier where appropriate:
customers["Customer_ID"].duplicated().sum()Before calling a record a duplicate, ask:
- Should this identifier be unique?
- Can one customer have multiple transactions?
- Do repeated records contain different dates or products?
- Are all column values identical?
- Could the repetition represent a valid business event?
Inspect Categorical Values
customers["Subscription_Type"].value_counts(
    dropna=False
)customers["Subscription_Type"].unique()Look for:
- Unexpected categories
- Blank strings
- Misspellings
- Different capitalization
- Leading or trailing spaces
- Very rare categories
Premium, premium, PREMIUM,
Premium and Premum may represent one
category written inconsistently.
Inspect Important Numeric Ranges
Inspect the largest values:
customers.sort_values(
    "Monthly_Charges",
    ascending=False
).head(10)
Inspect the smallest values:
customers.sort_values(
    "Monthly_Charges"
).head(10)
Apply relevant business rules:
customers[
    customers["Age"] < 0
]
customers[
customers["Monthly_Charges"] < 0
]A very large value could represent:
- A valuable corporate customer
- A data-entry mistake
- A currency problem
- A duplicated transaction
- A legitimate seasonal event
Check Date Coverage
customers["Join_Date"] = pd.to_datetime(
    customers["Join_Date"],
    errors="coerce"
)
Inspect the date range:
customers["Join_Date"].min()
customers["Join_Date"].max()
Check values that could not be converted:
customers["Join_Date"].isna().sum()Confirm the Dataset Can Answer the Question
Return to the original business question. For customer-churn analysis, confirm that the dataset contains:
- A customer identifier
- A reliable churn indicator
- Relevant customer characteristics
- Enough records for useful comparisons
- An appropriate time period
- Clearly defined categories
Create a Data Inspection Summary
| Inspection Area | Question to Answer |
|---|---|
| Dataset size | How many rows and columns are present? |
| Row meaning | What does one row represent? |
| Column meaning | What does each important column contain? |
| Data types | Are columns stored appropriately? |
| Missing values | Which columns contain missing data? |
| Duplicates | Are there confirmed duplicate records? |
| Categories | Are category values consistent? |
| Numeric ranges | Are values reasonable? |
| Date coverage | What time period does the data represent? |
| Business suitability | Can the dataset answer the required question? |
Inspection, Cleaning and EDA Are Different Stages
| Stage | Questions It Answers |
|---|---|
| Data inspection | What does the dataset contain? What problems may exist? Can it answer the question? |
| Data cleaning | Which problems should be corrected? Which method should be used? How will changes be validated? |
| Exploratory data analysis | What patterns and relationships exist? Which groups behave differently? What needs further investigation? |
Keeping these stages separate makes the analysis easier to explain, validate and reproduce.
Common Data Inspection Mistakes
- Looking only at the first five rows
- Cleaning before recording the original condition
- Treating every repeated identifier as a duplicate
- Calculating averages for identifiers
- Assuming every
objectcolumn is correctly stored - Ignoring blank strings and placeholder values
- Removing unusual values without investigation
- Inspecting data without understanding the business question
- Assuming that a large dataset must be useful
- Forgetting to document limitations
A Reusable Inspection Workflow
import pandas as pd

df = pd.read_csv("dataset.csv")

print("First five rows:")
display(df.head())

print("Shape:")
print(df.shape)

print("Columns:")
print(df.columns.tolist())

print("Dataset information:")
df.info()

print("Numeric summary:")
display(df.describe())

print("Missing values:")
display(df.isna().sum())

print("Duplicate rows:")
print(df.duplicated().sum())
After running this starter code, inspect important categories, numeric ranges, dates and identifiers based on the dataset and business question.
Inspect Before You Analyze
Data inspection is the bridge between receiving a dataset and making reliable decisions with it.
A strong analyst first determines:
- What the data represents
- Whether it is complete
- Whether it is stored correctly
- Which problems require attention
- Whether it can answer the business question
Careful inspection reduces mistakes during cleaning, analysis and visualization. It also demonstrates something employers value greatly: the ability to explain why your results should be trusted.